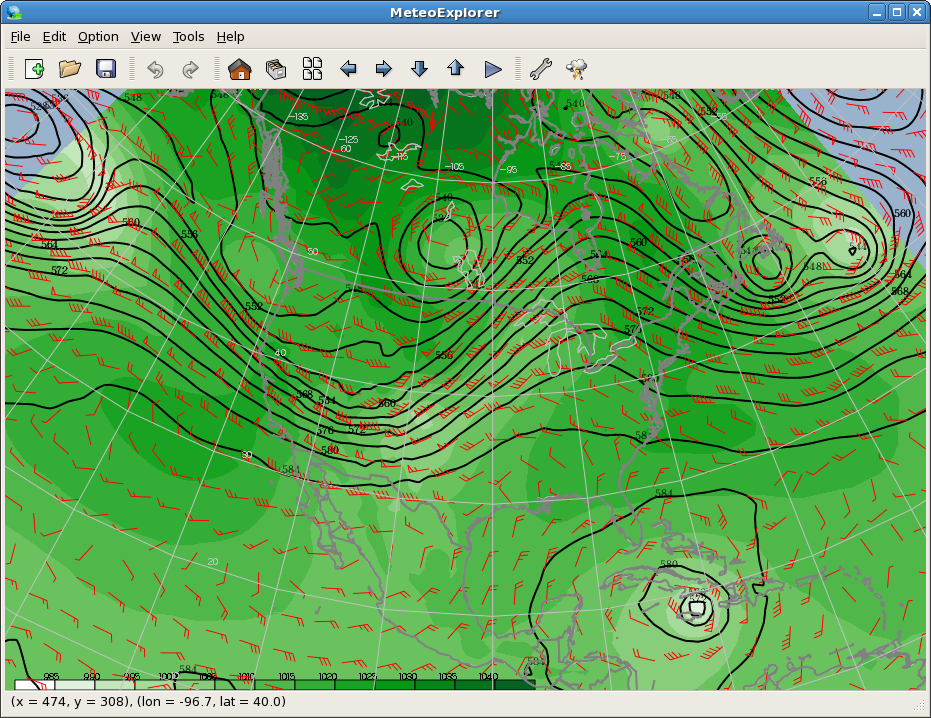
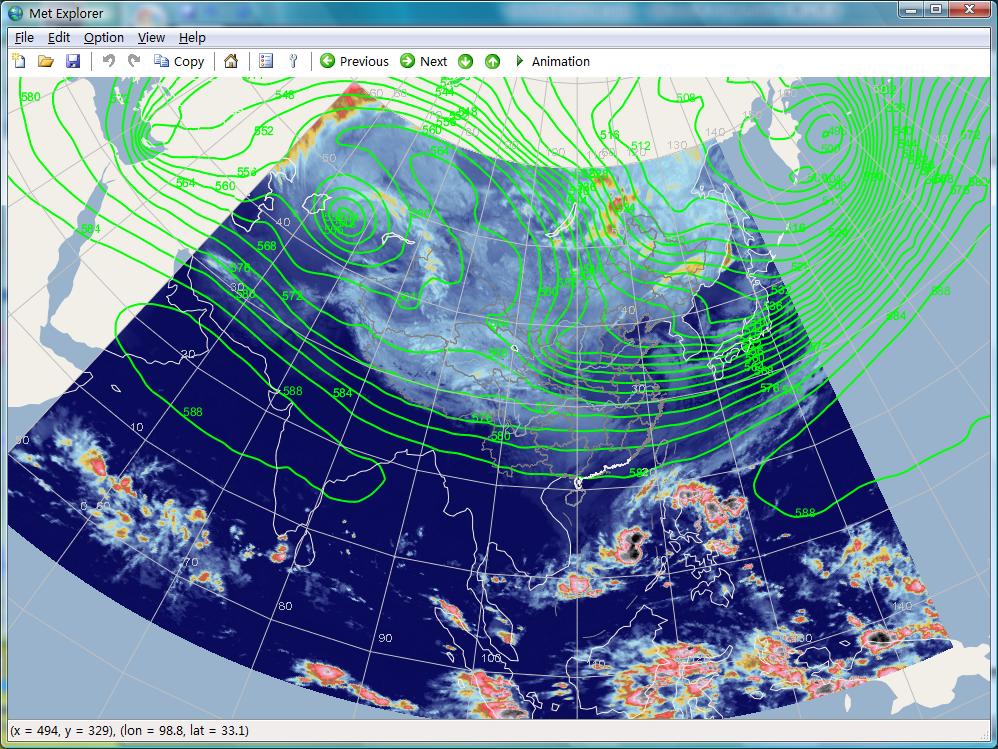
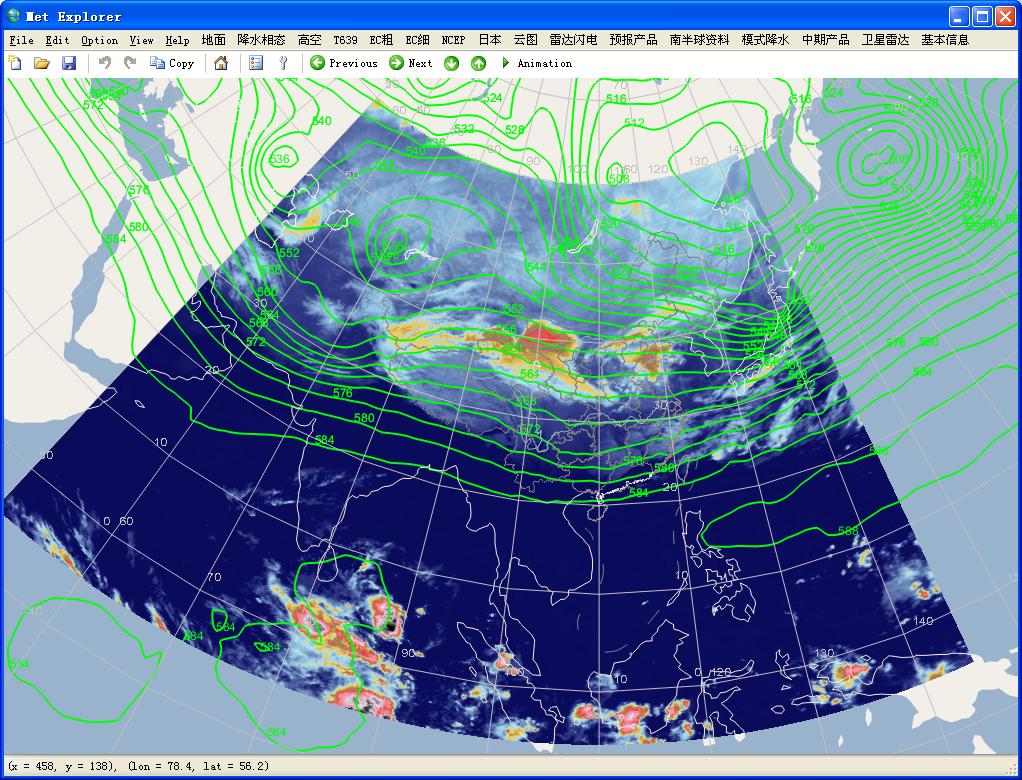
MeteoExplorer

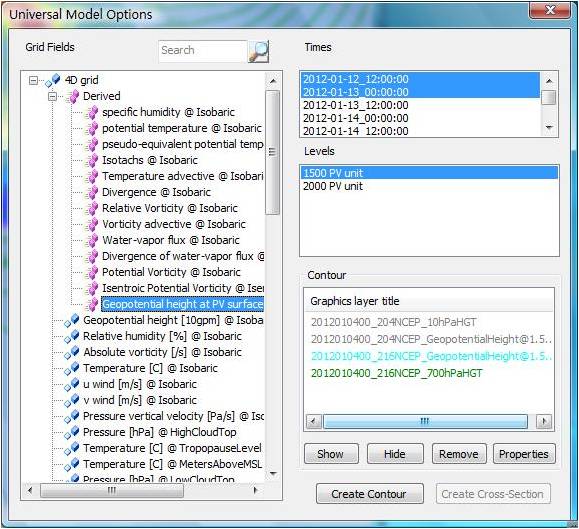
MeteoExplorer is a cross-platform software for analyzing and rendering atmospheric science and geoscience data. It supports popular data formats including WMO GRIB1/GRIB2, NetCDF, and MICAPS, and provides basic GIS functionalities. Developed with C++, MeteoExplorer targets multiple computing platforms including Microsoft Windows, GNU Linux, and Mac OS X operating systems.

MeteoExplorer in action
MeteoExplorer shows sea level pressure (shaded green), 500hPa height (black contours), and wind (red barbs) in United States on October 25, 2012, when hurricane Sandy reached its climax.

Technical advantages (top 6 reasons to choose ME)

  1. Unified 2D-3D rendering

    Three rendering views (2D, 2.5D Columbus, and 3D globe view) are provided. By fast switching among the three views on-the-fly, users may get better insight of the data.

  2. Cross-platform support

    Native support for Windows, Linux, and Mac OS X operating system, you can get your work done on your favorite platform.

  3. High performance
    • Developed with native C++;
    • Low system resource requirements;
    • Fast startup;
    • Hardware acceleration rendering with OpenGL.
  4. Vector graphics output at your fingertip

    Thanks to our cutting-edge rendering engine, you can export screen content as vector graphics image and paste it into your document or presentation.

  5. Objective analysis everywhere

    MeteoExplorer provides advanced objective analysis method that meets the requirements of real-world operation. Isolines of analytical field not only agree well with observatory data, but are as elegantly smooth as those manually drawn by forecasters.

  6. Support all popular meteorological data formats.

    MeteoExplorer supports commonly used data formats including WMO GRIB1/GRIB2, NetCDF, GrADS, and MICAPS (1,2,3,4,14), and hopes to free users from chores of processing data.


Feature list

  • Graphics layer management (navigation and animation);
  • Objective analysis of physical variables in both surface and upperair soundings data;
  • Isoline analysis and shading of grid field;
  • Streamline analysis of wind field;
  • Computation of physics index and variables from basic variables (pressure, temperature, wind etc.);
  • NetCDF data process and display;
  • GRIB1/GRIB2 data process and display;
  • GrADS data process and display;
  • MICAPS data process and display;
  • Satellite nephogram data display and animation, support AWX, GPF and HDF format;
  • Interactive composition of synoptic chart (command undo/redo, automatic save);
  • Meso-scale synoptic analysis;
  • Creation of cross-section graphics;
  • Map zoom, pan, projection and clipping;
  • Full screen display and zoom to area;
  • Quick navigation via thumbnail view of graphics layers;
  • Save screen shot as image file (support formats: BMP, JPG, PNG);
  • Vector graphics exported to clipboard or saved as EMF file (Windows version only);
  • Flexible system configuration (dynamic menu);
  • Fast switch of user interface language on the fly.

System requirements

  • Supported operating systems:
    • Windows XP/Vista/7/8/10
    • Redhat Enterprise Linux 5/6/7 and its open source variants (Fedora, CentOS)
    • Mac OS X 10.5 (Lion) or later
    • SGI Irix 6.5
  • Processor and memory:
    • PC: Intel Core 2 1.5GHz, 2GB RAM
    • SGI Workstation: MIPS R16000A 800MHz, 1GB RAM
  • Graphics card:
    • minimum: OpenGL 1.1
    • recommended: OpenGL 3

Example gallery